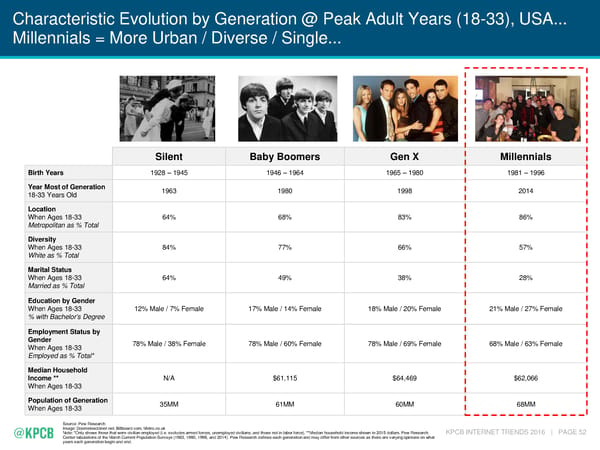
Characteristic Evolution by Generation @ Peak Adult Years (18-33), USA... Millennials = More Urban / Diverse / Single... Silent Baby Boomers Gen X Millennials Birth Years 1928 – 1945 1946 – 1964 1965 – 1980 1981 – 1996 Year Most of Generation 1963 1980 1998 2014 18-33 Years Old Location When Ages 18-33 64% 68% 83% 86% Metropolitan as % Total Diversity When Ages 18-33 84% 77% 66% 57% White as % Total Marital Status When Ages 18-33 64% 49% 38% 28% Married as % Total Education by Gender When Ages 18-33 12% Male / 7% Female 17% Male / 14% Female 18% Male / 20% Female 21% Male / 27% Female % with Bachelor’s Degree Employment Status by Gender 78% Male / 38% Female 78% Male / 60% Female 78% Male / 69% Female 68% Male / 63% Female When Ages 18-33 Employed as % Total* Median Household Income ** N/A $61,115 $64,469 $62,066 When Ages 18-33 Population of Generation 35MM 61MM 60MM 68MM When Ages 18-33 Source: Pew Research Image: Doomsteaddiner.net, Billboard.com, Metro.co.uk Note: *Only shows those that were civilian employed (i.e. excludes armed forces, unemployed civilians, and those not in labor force). **Median household income shown in 2015 dollars. Pew Research KPCB INTERNET TRENDS 2016 | PAGE 52 Center tabulations of the March Current Population Surveys (1963, 1980, 1998, and 2014). Pew Research defines each generation and may differ from other sources as there are varying opinions on what years each generation begin and end.
 Mary Meeker's Annual Internet Trends Report Page 52 Page 54