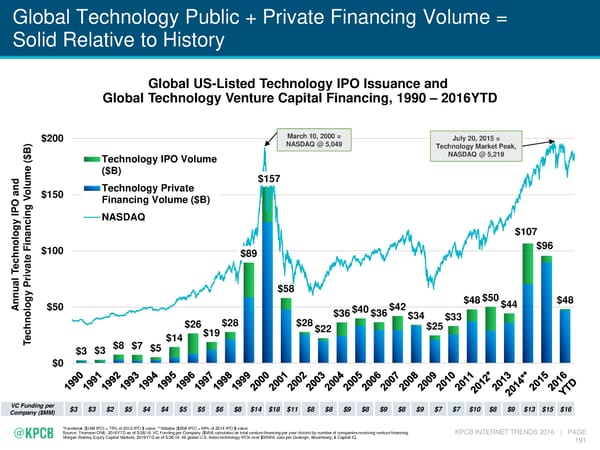
Global Technology Public + Private Financing Volume = Solid Relative to History Global US-Listed Technology IPO Issuance and Global Technology Venture Capital Financing, 1990 – 2016YTD $200 March 10, 2000 = July 20, 2015 = ) NASDAQ @ 5,049 Technology Market Peak, B NASDAQ @ 5,219 $ Technology IPO Volume ( e ($B) nd um Technology Private $157 a ol $150 O V Financing Volume ($B) P I ng i NASDAQ ogy nc $107 na $96 Fi $100 hnol $89 e c t e a T v i l r P $58 $50 $48 nnua ogy $50 $42 $48 $44 A $40 $28 $28 $36 $36 $34 $33 hnol $26 $22 $25 c $19 e $14 T $3 $3 $8 $7 $5 $0 VC Funding per $3 $3 $2 $5 $4 $4 $5 $5 $6 $8 $14 $18 $11 $8 $8 $9 $8 $9 $8 $9 $7 $7 $10 $8 $9 $13 $15 $16 Company ($MM) *Facebook ($16B IPO) = 75% of 2012 IPO $ value. **Alibaba ($25B IPO) = 69% of 2014 IPO $ value. Source: Thomson ONE, 2016YTD as of 5/26/16. VC Funding per Company ($MM) calculated as total venture financing per year divided by number of companies receiving venture financing. KPCB INTERNET TRENDS 2016 | PAGE Morgan Stanley Equity Capital Markets, 2016YTD as of 5/26/16. All global U.S.-listed technology IPOs over $30MM, data per Dealogic, Bloomberg, & Capital IQ. 191
 Mary Meeker's Annual Internet Trends Report Page 191 Page 193