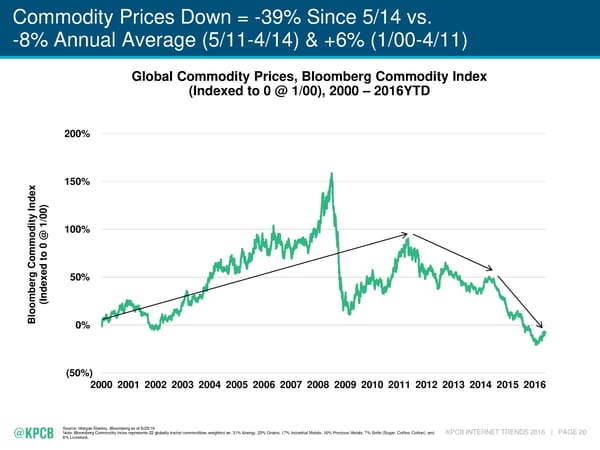
Commodity Prices Down = -39% Since 5/14 vs. -8% Annual Average (5/11-4/14) & +6% (1/00-4/11) Global Commodity Prices, Bloomberg Commodity Index (Indexed to 0 @ 1/00), 2000 – 2016YTD 200% 150% x nde I 00) y t 1/ odi @ 100% m 0 om o t g C 50% r exed be d n I ( oom l B 0% (50%) 2000 2001 2002 2003 2004 2005 2006 2007 2008 2009 2010 2011 2012 2013 2014 2015 2016 Source: Morgan Stanley, Bloomberg as of 5/25/16 Note: Bloomberg Commodity Index represents 22 globally traded commodities, weighted as: 31% Energy, 23% Grains, 17% Industrial Metals, 16% Precious Metals, 7% Softs (Sugar, Coffee, Cotton), and KPCB INTERNET TRENDS 2016 | PAGE 20 6% Livestock.
 Mary Meeker's Annual Internet Trends Report Page 20 Page 22