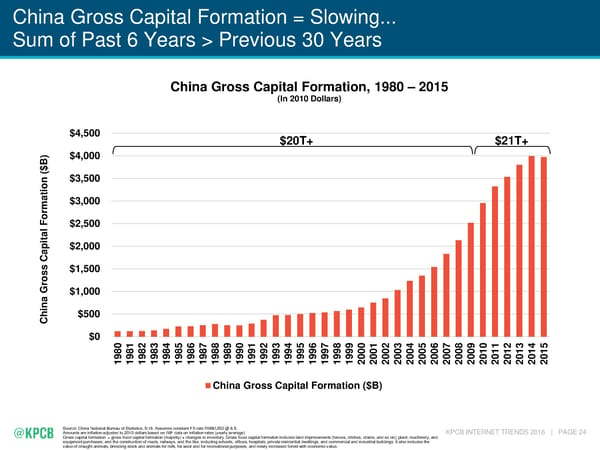
China Gross Capital Formation = Slowing... Sum of Past 6 Years > Previous 30 Years China Gross Capital Formation, 1980 – 2015 (In 2010 Dollars) $4,500 $20T+ $21T+ ) $4,000 B $ ( $3,500 on i t a $3,000 m For $2,500 l a t pi $2,000 a C s $1,500 os r $1,000 G na hi $500 C $0 80 81 82 83 84 85 86 87 88 89 90 91 92 93 94 95 96 97 98 99 00 01 02 03 04 05 06 07 08 09 10 11 12 13 14 15 19 19 19 19 19 19 19 19 19 19 19 19 19 19 19 19 19 19 19 19 20 20 20 20 20 20 20 20 20 20 20 20 20 20 20 20 China Gross Capital Formation ($B) Source: China National Bureau of Statistics, 5/16. Assumes constant FX rate RMB/USD @ 6.5. Amounts are inflation adjusted to 2010 dollars based on IMF data on inflation rates (yearly average). KPCB INTERNET TRENDS 2016 | PAGE 24 Gross capital formation = gross fixed capital formation (majority) + changes in inventory. Gross fixed capital formation includes land improvements (fences, ditches, drains, and so on); plant, machinery, and equipment purchases; and the construction of roads, railways, and the like, including schools, offices, hospitals, private residential dwellings, and commercial and industrial buildings. It also includes the value of draught animals, breeding stock and animals for milk, for wool and for recreational purposes, and newly increased forest with economic value.
 Mary Meeker's Annual Internet Trends Report Page 24 Page 26