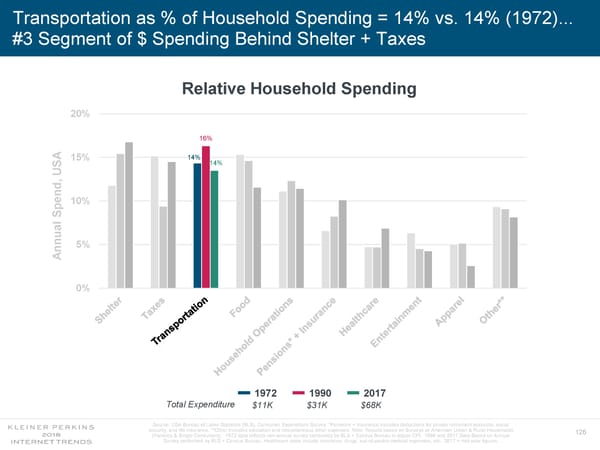
Transportation as % of Household Spending = 14% vs. 14% (1972)... #3 Segment of $ Spending Behind Shelter + Taxes Relative Household Spending 20% 16% 14% 15% 14% SA U , d en 10% Sp al u n 5% n A 0% 1972 1990 2017 Total Expenditure $11K $31K $68K Source: USA Bureau of Labor Statistics (BLS), Consumer Expenditure Survey. *Pensions + Insurance includes deductions for private retirement accounts, social security, and life insurance. **Other Includes education and miscellaneous other expenses. Note: Results based on Surveys of American Urban & Rural Households 126 (Families & Single Consumers). 1972 data reflects non-annual survey conducted by BLS + Census Bureau to adjust CPI. 1990 and 2017 Data Based on Annual Survey performed by BLS + Census Bureau. Healthcare costs include insurance, drugs, out-of-pocket medical expenses, etc.. 2017 = mid-year figures.
 Internet Trends 2018 Page 125 Page 127