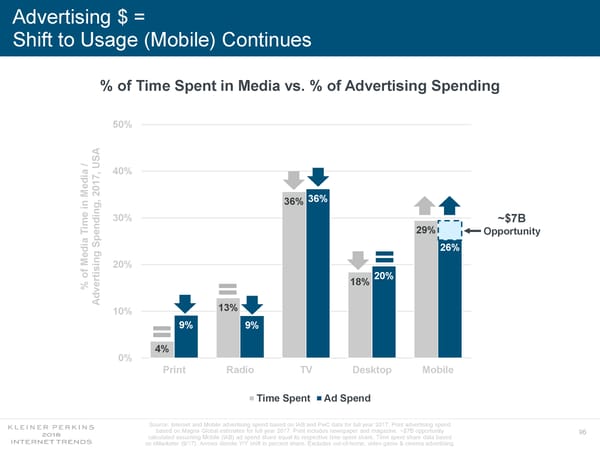
Advertising $ = Shift to Usage (Mobile) Continues % of Time Spent in Media vs. % of Advertising Spending 50% / USA , 40% 7 dia 1 0 2 36% 36% in Me 30% ~$7B imending, 29% T Opportunity pe S dia 26% ing Me 20% of 20% rtis 18% e % dv A 13% 10% 9% 9% 4% 0% Print Radio TV Desktop Mobile Time Spent Ad Spend Source: Internet and Mobile advertising spend based on IAB and PwC data for full year 2017. Print advertising spend based on Magna Global estimates for full year 2017. Print includes newspaper and magazine. ~$7B opportunity 96 calculated assuming Mobile (IAB) ad spend share equal its respective time spent share. Time spent share data based on eMarketer (9/17). Arrows denote Y/Y shift in percent share. Excludes out-of-home, video game & cinema advertising.
 Internet Trends 2018 Page 95 Page 97