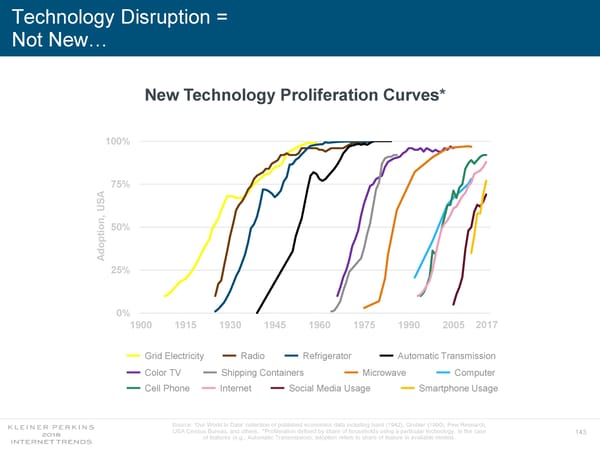
Technology Disruption = Not New… New Technology Proliferation Curves* 100% 75% USA n, 50% io dopt A 25% 0% 1900 1915 1930 1945 1960 1975 1990 2005 2017 Grid Electricity Radio Refrigerator Automatic Transmission Color TV Shipping Containers Microwave Computer Cell Phone Internet Social Media Usage Smartphone Usage Source: ‘Our World In Data’ collection of published economics data including Isard (1942), Grubler (1990), Pew Research, USA Census Bureau, and others. *Proliferation defined by share of households using a particular technology. In the case 143 of features (e.g., Automatic Transmission), adoption refers to share of feature in available models.
 Internet Trends 2018 Page 142 Page 144