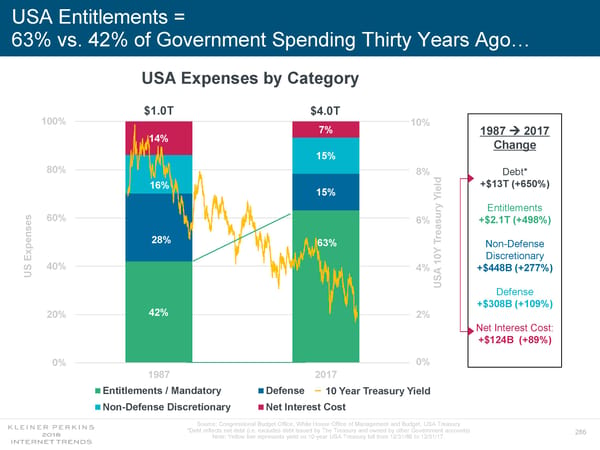
USA Entitlements = 63% vs. 42% of Government Spending Thirty Years Ago… USA Expenses by Category $1.0T $4.0T 100% 10% 7% 1987 2017 14% Change 15% 80% 8% Debt* ld +$13T (+650%) 16% ie 15% Y Entitlements s ury 60% 6% s +$2.1T (+498%) e a ns re 28% T 63% Non-Defense pe x Y 0 Discretionary E 1 40% 4% +$448B (+277%) US USA Defense +$308B (+109%) 42% 20% 2% Net Interest Cost: +$124B (+89%) 0% 0% 1987 2017 Entitlements / Mandatory Defense 10 Year Treasury Yield Non-Defense Discretionary Net Interest Cost Source: Congressional Budget Office, White House Office of Management and Budget, USA Treasury *Debt reflects net debt (i.e. excludes debt issued by The Treasury and owned by other Government accounts) 286 Note: Yellow line represents yield on 10-year USA Treasury bill from 12/31/86 to 12/31/17.
 Internet Trends 2018 Page 285 Page 287