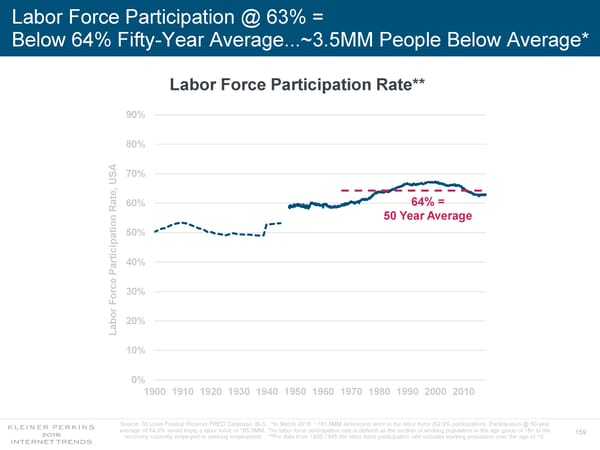
Labor Force Participation @ 63% = Below 64% Fifty-Year Average...~3.5MM People Below Average* Labor Force Participation Rate** 90% 80% 70% USA , 60% 64% = Rate 50 Year Average tion 50% ipa rtic 40% a P e 30% bor Forc20% La 10% 0% 1900 1910 1920 1930 1940 1950 1960 1970 1980 1990 2000 2010 Source: St Louis Federal Reserve FRED Database, BLS. *In March 2018, ~161.8MM Americans were in the labor force (62.9% participation). Participation @ 50-year average of 64.3% would imply a labor force of 165.3MM. The labor force participation rate is defined as the section of working population in the age group of 16+ in the 159 economy currently employed or seeking employment. **For data from 1900-1945 the labor force participation rate includes working population over the age of 10.
 Internet Trends 2018 Page 158 Page 160