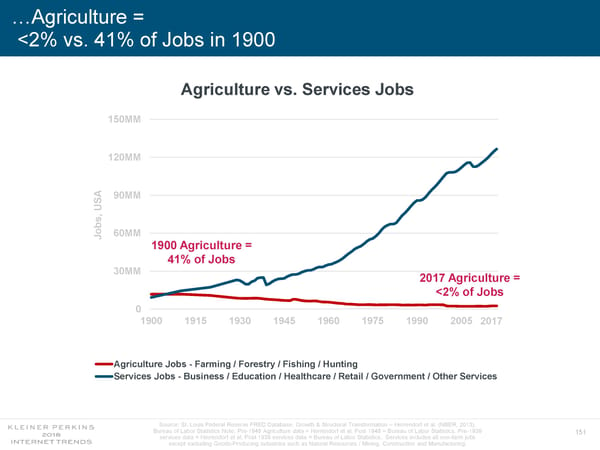
…Agriculture = <2% vs. 41% of Jobs in 1900 Agriculture vs. Services Jobs 150MM 120MM 90MM SA U 60MM Jobs, 1900 Agriculture = 41% of Jobs 30MM 2017 Agriculture = <2% of Jobs 0 1900 1915 1930 1945 1960 1975 1990 2005 2017 Agriculture Jobs - Farming / Forestry / Fishing / Hunting Services Jobs - Business / Education / Healthcare / Retail / Government / Other Services Source: St. Louis Federal Reserve FRED Database, Growth & Structural Transformation – Herrendorf et al. (NBER, 2013), Bureau of Labor Statistics Note: Pre-1948 Agriculture data = Herrendorf et al. Post 1948 = Bureau of Labor Statistics. Pre-1939 151 services data = Herrendorf et al. Post 1939 services data = Bureau of Labor Statistics. Services includes all non-farm jobs except excluding Goods-Producing industries such as Natural Resources / Mining, Construction and Manufacturing.
 Internet Trends 2018 Page 150 Page 152