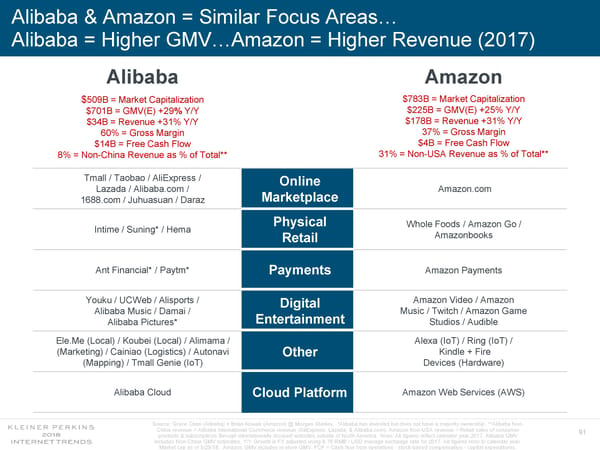
Alibaba & Amazon = Similar Focus Areas… Alibaba = Higher GMV…Amazon = Higher Revenue (2017) Alibaba Amazon $509B= Market Capitalization $783B = Market Capitalization $225B = GMV(E) +25% Y/Y $701B = GMV(E) +29%Y/Y $178B = Revenue +31% Y/Y $34B = Revenue +31% Y/Y 37% = Gross Margin 60% = Gross Margin $4B = Free Cash Flow $14B = Free Cash Flow 31% = Non-USA Revenue as % of Total** 8% = Non-China Revenue as % of Total** Tmall / Taobao / AliExpress / Online Lazada / Alibaba.com / Amazon.com Marketplace 1688.com / Juhuasuan / Daraz Physical Whole Foods / Amazon Go / Intime / Suning* / Hema Amazonbooks Retail Ant Financial* / Paytm* Amazon Payments Payments Youku / UCWeb / Alisports / Amazon Video / Amazon Digital Alibaba Music / Damai / Music / Twitch / Amazon Game Entertainment Alibaba Pictures* Studios / Audible Ele.Me (Local) / Koubei (Local) / Alimama / Alexa (IoT) / Ring (IoT) / (Marketing) / Cainiao (Logistics) / Autonavi Kindle + Fire Other (Mapping) / Tmall Genie (IoT) Devices (Hardware) Alibaba Cloud Amazon Web Services (AWS) Cloud Platform Source: Grace Chen (Alibaba) + Brian Nowak (Amazon) @ Morgan Stanley. *Alibaba has invested but does not have a majority ownership. **Alibaba Non- China revenue = Alibaba International Commerce revenue (AliExpress, Lazada, & Alibaba.com). Amazon Non-USA revenue = Retail sales of consumer 91 products & subscriptions through internationally-focused websites outside of North America. Note: All figures reflect calendar year 2017. Alibaba GMV includes Non-China GMV estimates, Y/Y Growth is FX adjusted using 6.76 RMB / USD average exchange rate for 2017. All figures refer to calendar year. Market cap as of 5/29/18. Amazon GMV includes in-store GMV. FCF = Cash flow from operations - stock-based compensation - capital expenditures.
 Internet Trends 2018 Page 90 Page 92