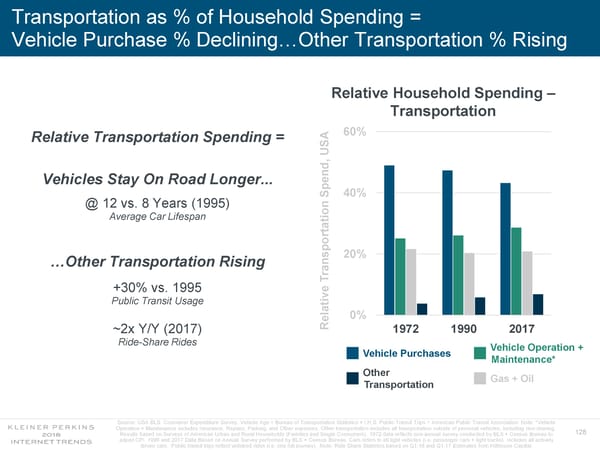
Transportation as % of Household Spending = Vehicle Purchase % Declining…Other Transportation % Rising Relative Household Spending – Transportation 60% Relative Transportation Spending = SA U , d en Vehicles Stay On Road Longer... Sp 40% @ 12 vs. 8 Years (1995) n o Average Car Lifespan tati r o sp 20% …Other Transportation Rising an r T +30% vs. 1995 e v Public Transit Usage ati 0% el R ~2x Y/Y (2017) 1972 1990 2017 Ride-Share Rides Vehicle Operation + Vehicle Purchases Maintenance* Other Gas + Oil Transportation Source: USA BLS Consumer Expenditure Survey. Vehicle Age = Bureau of Transportation Statistics + I.H.S. Public Transit Trips = American Public Transit Association Note: *Vehicle Operation + Maintenance includes Insurance, Repairs, Parking, and Other expenses. Other transportation includes all transportation outside of personal vehicles, including rise-sharing.. 128 Results based on Surveys of American Urban and Rural Households (Families and Single Consumers). 1972 data reflects non-annual survey conducted by BLS + Census Bureau to adjust CPI. 1990 and 2017 Data Based on Annual Survey performed by BLS + Census Bureau. Cars refers to all light vehicles (i.e. passenger cars + light trucks). Includes all actively driven cars. Public transit trips reflect unlinked rides (i.e. one full journey). Note: Ride Share Statistics based on Q1:16 and Q1:17 Estimates from Hillhouse Capital.
 Internet Trends 2018 Page 127 Page 129