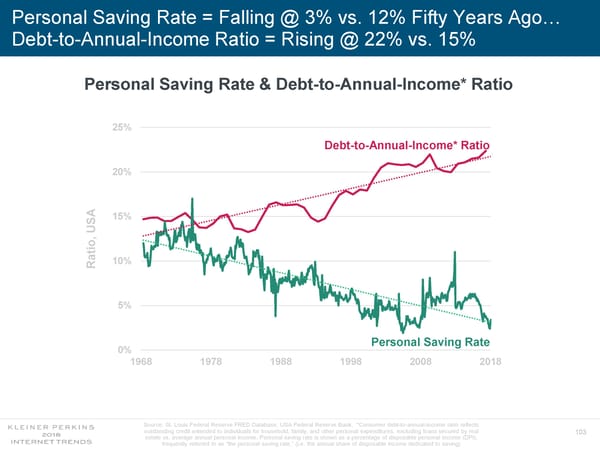
Personal Saving Rate = Falling @ 3% vs. 12% Fifty Years Ago… Debt-to-Annual-Income Ratio = Rising @ 22% vs. 15% Personal Saving Rate & Debt-to-Annual-Income* Ratio 25% Debt-to-Annual-Income* Ratio 20% 15% USA , o ati 10% R 5% Personal Saving Rate 0% 1968 1978 1988 1998 2008 2018 Source: St. Louis Federal Reserve FRED Database, USA Federal Reserve Bank. *Consumer debt-to-annual-income ratio reflects outstanding credit extended to individuals for household, family, and other personal expenditures, excluding loans secured by real 103 estate vs. average annual personal income. Personal saving rate is shown as a percentage of disposable personal income (DPI), frequently referred to as “the personal saving rate.” (i.e. the annual share of disposable income dedicated to saving)
 Internet Trends 2018 Page 102 Page 104