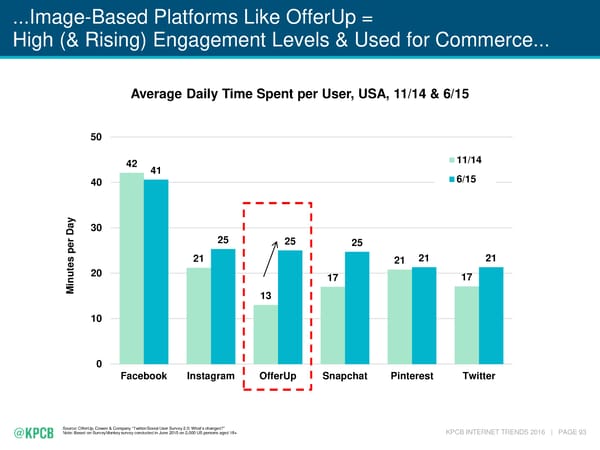
...Image-Based Platforms Like OfferUp = High (& Rising) Engagement Levels & Used for Commerce... Average Daily Time Spent per User, USA, 11/14 & 6/15 50 42 11/14 41 6/15 40 ay 30 D 25 25 25 er p 21 21 21 es 21 t 20 u 17 17 n i M 13 10 0 Facebook Instagram OfferUp Snapchat Pinterest Twitter Source: OfferUp, Cowen & Company “Twitter/Social User Survey 2.0: What’s changed?” Note: Based on SurveyMonkey survey conducted in June 2015 on 2,000 US persons aged 18+ KPCB INTERNET TRENDS 2016 | PAGE 93
 Mary Meeker's Annual Internet Trends Report Page 93 Page 95