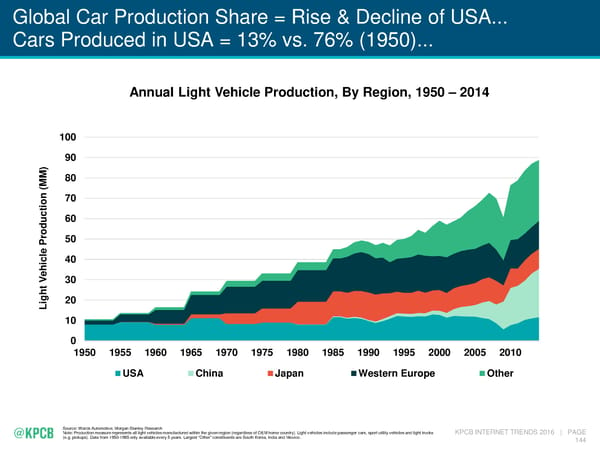
Global Car Production Share = Rise & Decline of USA... Cars Produced in USA = 13% vs. 76% (1950)... Annual Light Vehicle Production, By Region, 1950 – 2014 100 90 ) M 80 M ( on 70 i t 60 oduc r 50 P e l c 40 hi e V 30 ght 20 Li 10 0 1950 1955 1960 1965 1970 1975 1980 1985 1990 1995 2000 2005 2010 USA China Japan Western Europe Other Source: Wards Automotive, Morgan Stanley Research Note: Production measure represents all light vehicles manufactured within the given region (regardless of OEM home country). Light vehicles include passenger cars, sport utility vehicles and light trucks KPCB INTERNET TRENDS 2016 | PAGE (e.g. pickups). Data from 1950-1985 only available every 5 years. Largest “Other” constituents are South Korea, India and Mexico. 144
 Mary Meeker's Annual Internet Trends Report Page 144 Page 146