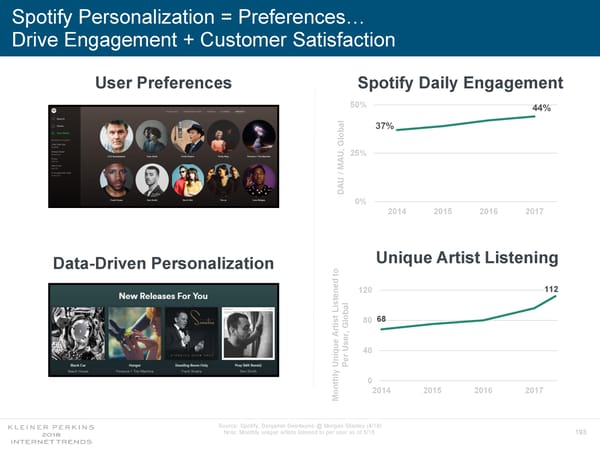
Spotify Personalization = Preferences… Drive Engagement + Customer Satisfaction User Preferences Spotify Daily Engagement 50% 44% al 37% lob G U, 25% A / M U DA 0% 2014 2015 2016 2017 Unique Artist Listening Data-Driven Personalization o t ed 120 112 isten al L lob 68 80 ist t r , G A r e Use40 iqu er P Un ly h t 0 n o 2014 2015 2016 2017 M Source: Spotify, Benjamin Swinburne @ Morgan Stanley (4/18) Note: Monthly unique artists listened to per user as of 5/18. 193
 Internet Trends 2018 Page 192 Page 194