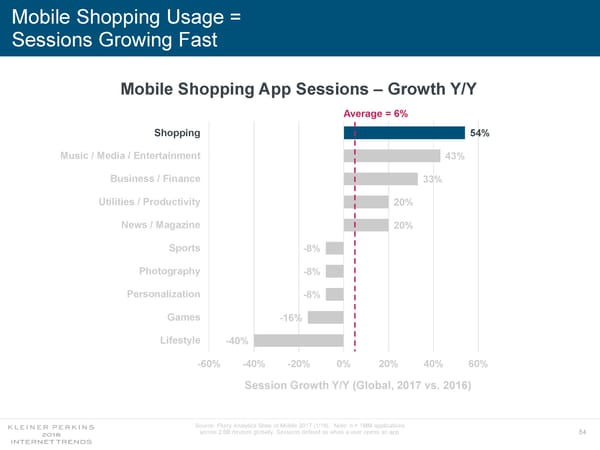
Mobile Shopping Usage = Sessions Growing Fast Mobile Shopping App Sessions – Growth Y/Y Average = 6% Shopping Shopping 54% Music / Media / Entertainment 43% Business / Finance 33% Utilities / Productivity 20% News / Magazine 20% Sports -8% Photography -8% Personalization -8% Games -16% Lifestyle -40% -60% -40% -20% 0% 20% 40% 60% Session Growth Y/Y (Global, 2017 vs. 2016) Source: Flurry Analytics State of Mobile 2017 (1/18). Note: n = 1MM applications across 2.6B devices globally. Sessions defined as when a user opens an app. 84
 Internet Trends 2018 Page 83 Page 85